One of my resolutions in 2026 was to limit my screen time on my phone. Unfortunately, I start my day with my phone by checking the weather, reading the news, and finding out when the next train is coming, and from there the doomscrolling commences. To combat this, I decided to make a dashboard that would display everything for me automatically.
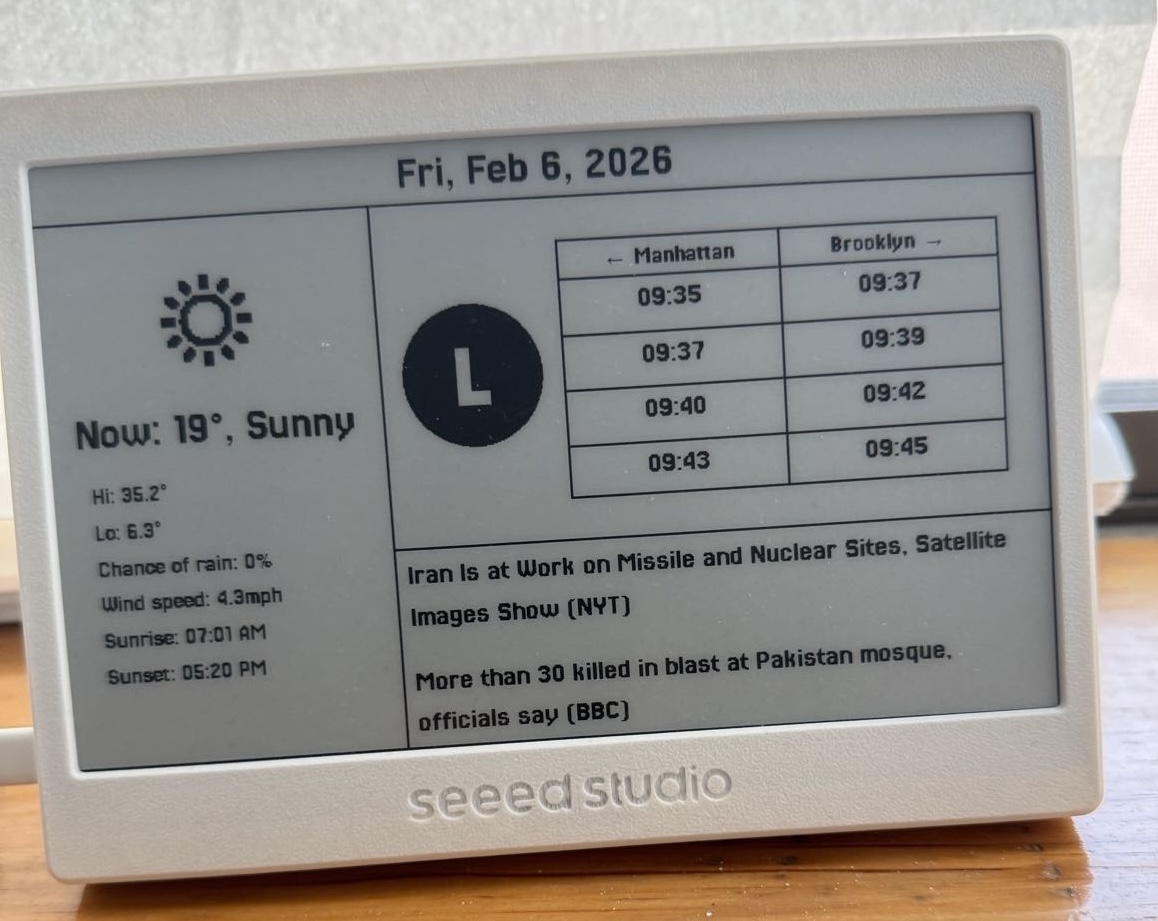
I’m pretty anti-clickbait, so to save some suspense, this is the finished product:
System Architecture
This is what is happening in a nutshell:
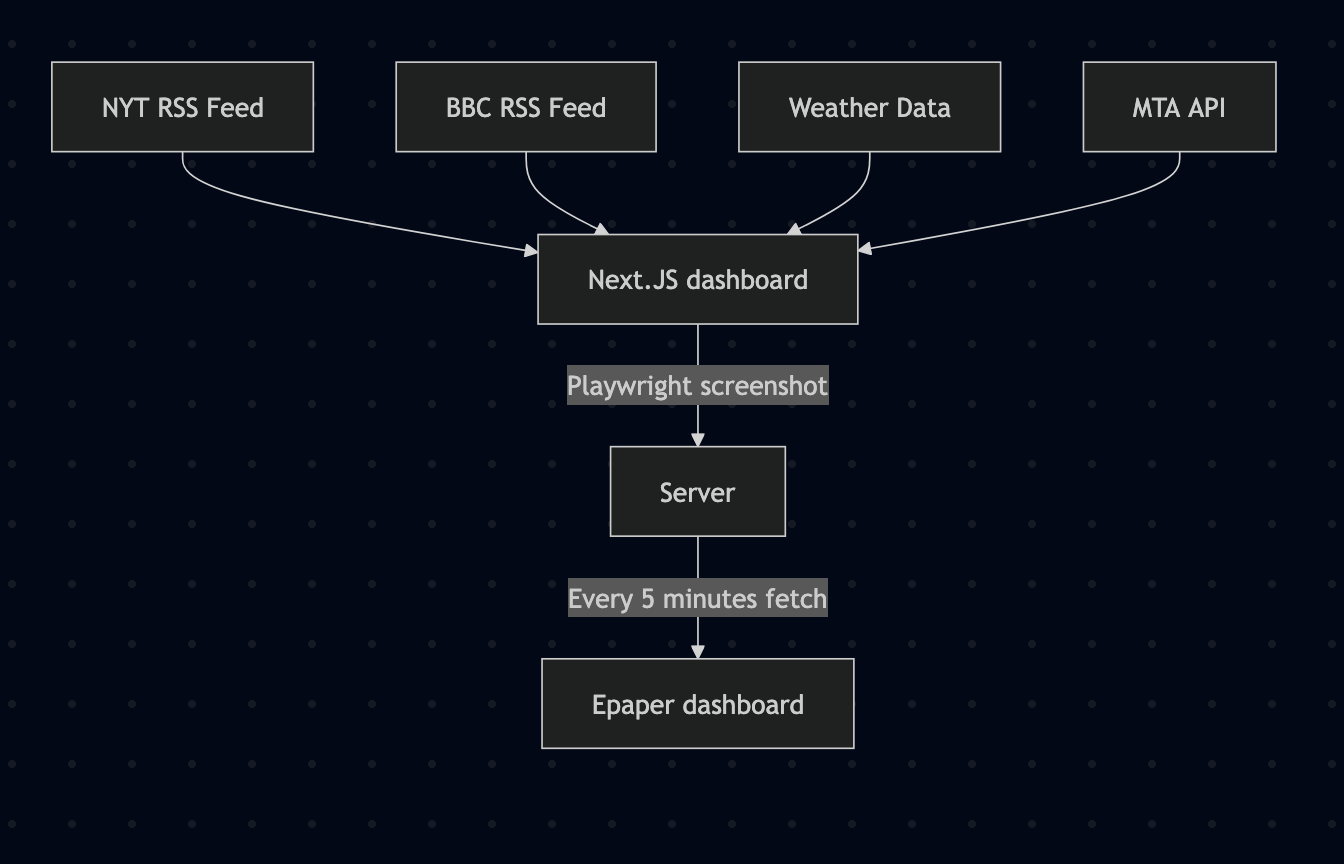
-
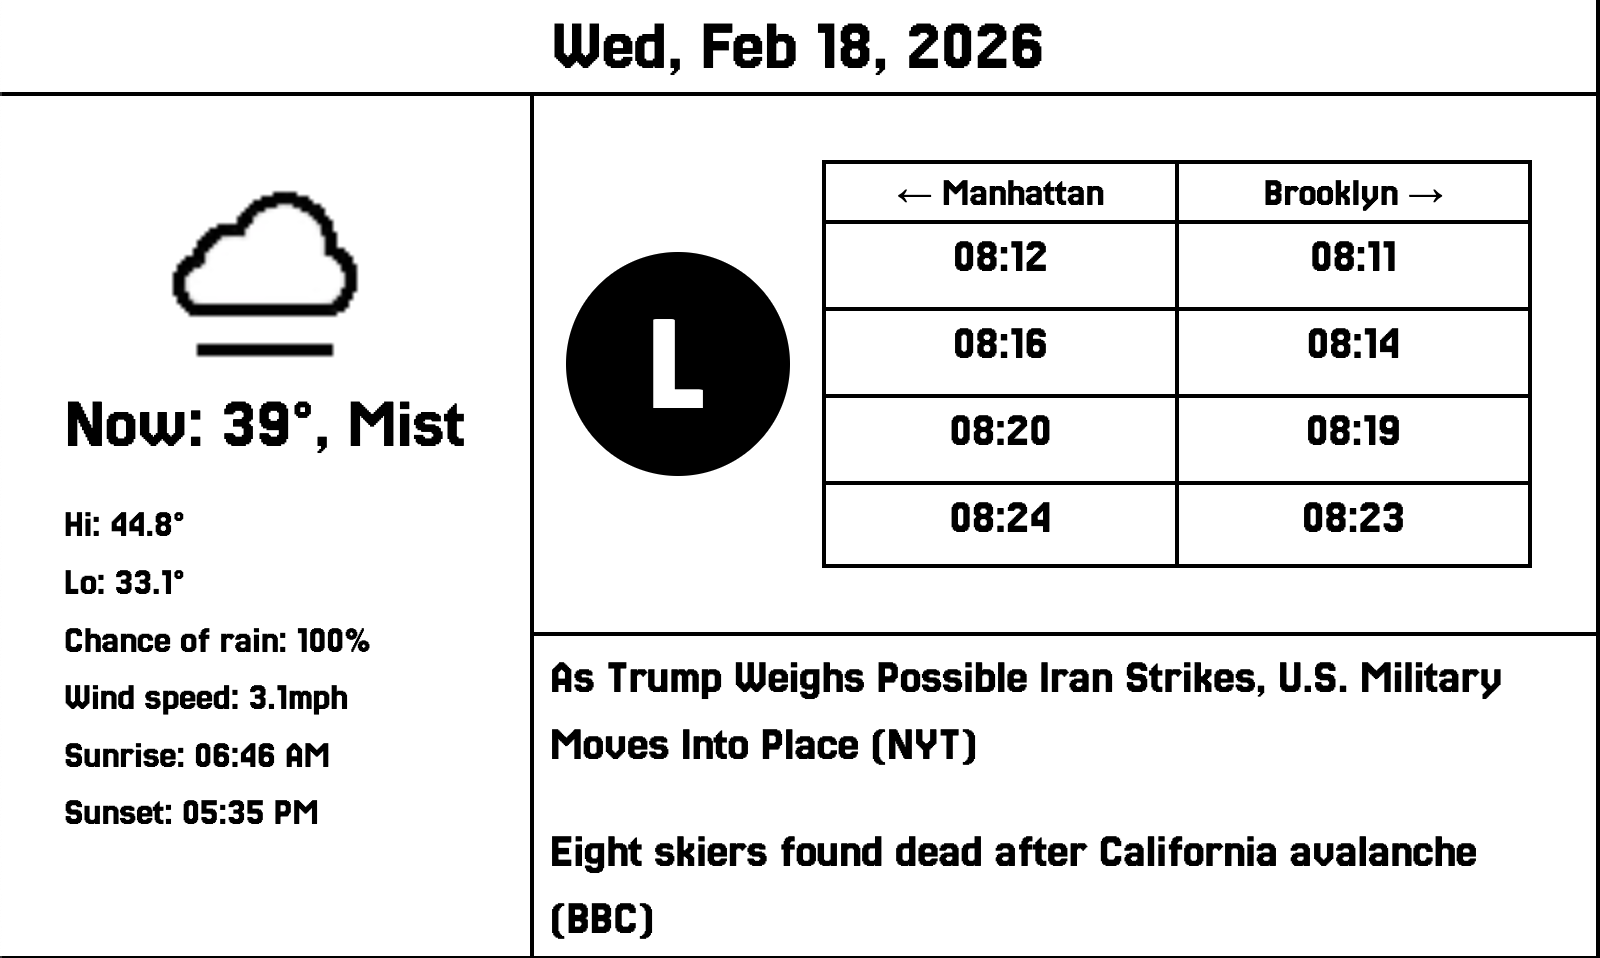
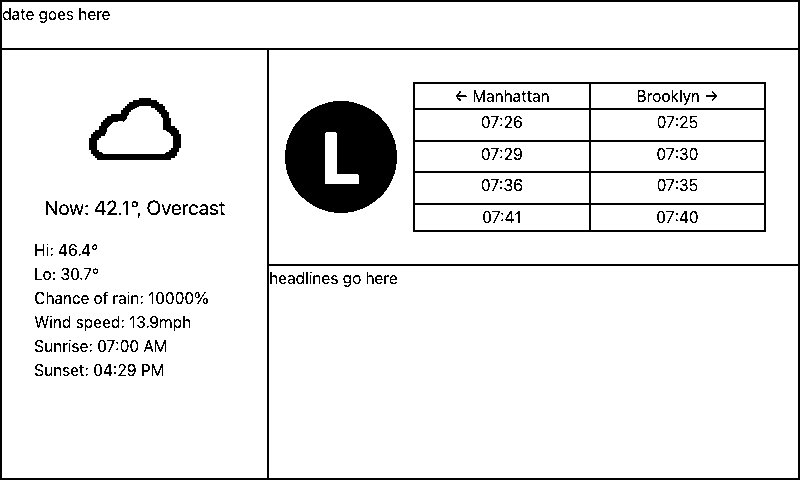
I have a dashboard set up in Next.JS that fetches the data I want to display and formats it in a way that makes sense. This is what that looks like (ignore the grim headlines):
- A server uses playwright to take a screenshot of this every 5 minutes, and exposes the bytes
- My actual dashboard fetches those bytes from the server and writes the output to the display, culminating in the lovely screen above. It sleeps in between fetches.
Now, to go a little more in-depth into each part.
The dashboard
Fetching the data and actually displaying it was simple enough, with the exception of the MTA data (why is there no publicly available list of what stations correspond to what stop ID’s? why do L trains run “North” and “South” in the API?).
There were some fun quirks for designing on epaper though. An epaper has two colors: black and white. Modern anti-aliased fonts actually look jagged and messy when using them for this, since all those anti-aliased gray pixels just become white with any sort of thresholding, and filling them in as black makes them look… worse (trust me). I needed to settle on a bitmap font, and ultimately went with VCR Mono, because it seemed the most mature (read: non-minecraft-y).
In that same vein, the weather API I am using has tons of great, high quality icons! But, and you might want to be sitting down for this: the Sun is yellow! Rain is blue! Clouds are gray! And what do we know about epaper? It has two colors, none of which I just listed above. I toyed around with trying to vibe-code a script that could help me out with this, but ultimately because I wanted certain things for certain colors (I wanted the clouds to not be filled in but lightning to be filled in, for example) I wound up opening each image in a basic image editor and using the fill tool to make them appear in a usable state. This was thirty-something icons for day and night (why are there so many weather conditions? what is the difference between fog and mist?), which took about 45 minutes all-in. I’m pretty happy with the results, though!
The server
The code that lives on the server is actually the most straightforward piece of this whole system. All it does is take a screenshot using Playwright, and then save those bytes. Here’s basically all the relevant code:
import io
import os
from playwright.sync_api import sync_playwright
from PIL import Image

with sync_playwright() as p:
    browser = p.chromium.launch()
    page = browser.new_page()
    page.goto("MY_DASHBOARD_URL")
    # take screenshot
    img_bytes = page.screenshot(clip={"x": 0, "y": 0, "width": 800, "height": 480})
    browser.close()

img = Image.open(io.BytesIO(img_bytes))
# threshold the image
bw = img.convert("L").point(lambda x: 0 if x < 128 else 255, "1")

bw = bw.resize((800, 480))

# Save raw framebuffer (no headers)
with open("file_path", "wb") as f:
    f.write(bw.tobytes())
I’m using nginx to expose the bytes to the network.
The arduino
This was the most challenging part for me, because I have basically no experience programming on an arduino. I watched my ex-girlfriend write something that streamed “Hello World” to an LED reader in college one time, and that’s about it.
There are three things that my code has to do to display the image:
- Connect to the network
- Download the image bytes
- Write the image to the screen
This would be very simple if I knew what I was doing, but I wasn't really. Here's an annotated copy of the core function downloadAndDraw() that I ultimately got working:
Click to reveal
void downloadAndDraw() {
  connectWiFi();

	# Get the image
  HTTPClient http;
  http.begin(IMAGE_URL);
  int httpCode = http.GET();
  if (httpCode != HTTP_CODE_OK) {
    Serial.printf("HTTP error: %d\n", httpCode);
    http.end();
    return;
  }

  WiFiClient* stream = http.getStreamPtr();
  int x = 0;
  int y = 0;
#ifdef EPAPER_ENABLE
  epaper.fillScreen(TFT_WHITE);
#endif
  const int BUFFER_SIZE = 256;
  uint8_t buffer[BUFFER_SIZE];
  int totalBytesRead = 0;
  const int expectedBytes = SCREEN_WIDTH * SCREEN_HEIGHT / 8;

	# Draw the image to the screen
  while (totalBytesRead < expectedBytes) {
    int len = stream->readBytes(buffer, BUFFER_SIZE);
    if (len == 0) {
      delay(1);
      continue;
    }

    for (int i = 0; i < len; i++) {
      uint8_t byte = buffer[i];
      totalBytesRead++;
      for (int bit = 7; bit >= 0; bit--) {
        bool pixel = byte & (1 << bit);
#ifdef EPAPER_ENABLE
        epaper.drawPixel(x, y, pixel ? TFT_WHITE : TFT_BLACK);
#endif
        x++;
        if (x >= SCREEN_WIDTH) {
          x = 0;
          y++;
          if (y >= SCREEN_HEIGHT) break;
        }
      }
    }
  }

#ifdef EPAPER_ENABLE
  epaper.update();
#endif

	# Cleanup
  http.end();
  WiFi.disconnect(true);
  WiFi.mode(WIFI_OFF);
  Serial.println("Image rendered and WiFi off");
}
I know reading code is boring, but essentially what this is doing is streaming the image from the server and writing each pixel as black/white to a buffer in memory that is the size of the display. Once the image is done streaming, we update the display.
One quirk that I hit because I’m a n00b:
if (len == 0) {
  delay(1);
  continue;
}
Data does not arrive uniformly from the network, and sometimes there are no bytes in the stream not because we are done downloading the image, but because there was just a bump in traffic or something. I didn’t have this block of code before, and so it was causing my dashboard to freeze horizontally and render an incomplete version of the screen, cut off a variable distance from the bottom. I triaged this with claude and these three lines saved me in the end.
Conclusion
I have this setup next to my bed, so every morning I can see the weather, news, and if something is deathly wrong with my commute at a glance, without having to look at some blue light or be bombarded by notifications. It hasn't made a very material impact on my every day, but taken together it is a nice change of pace.